I'm still taking it all in... even as just a breakdown it is useful as heck. Oh man, it would have been a dream for sorting through all those macros for that Storybook Ending "video/qtz". I would get lost sometimes!
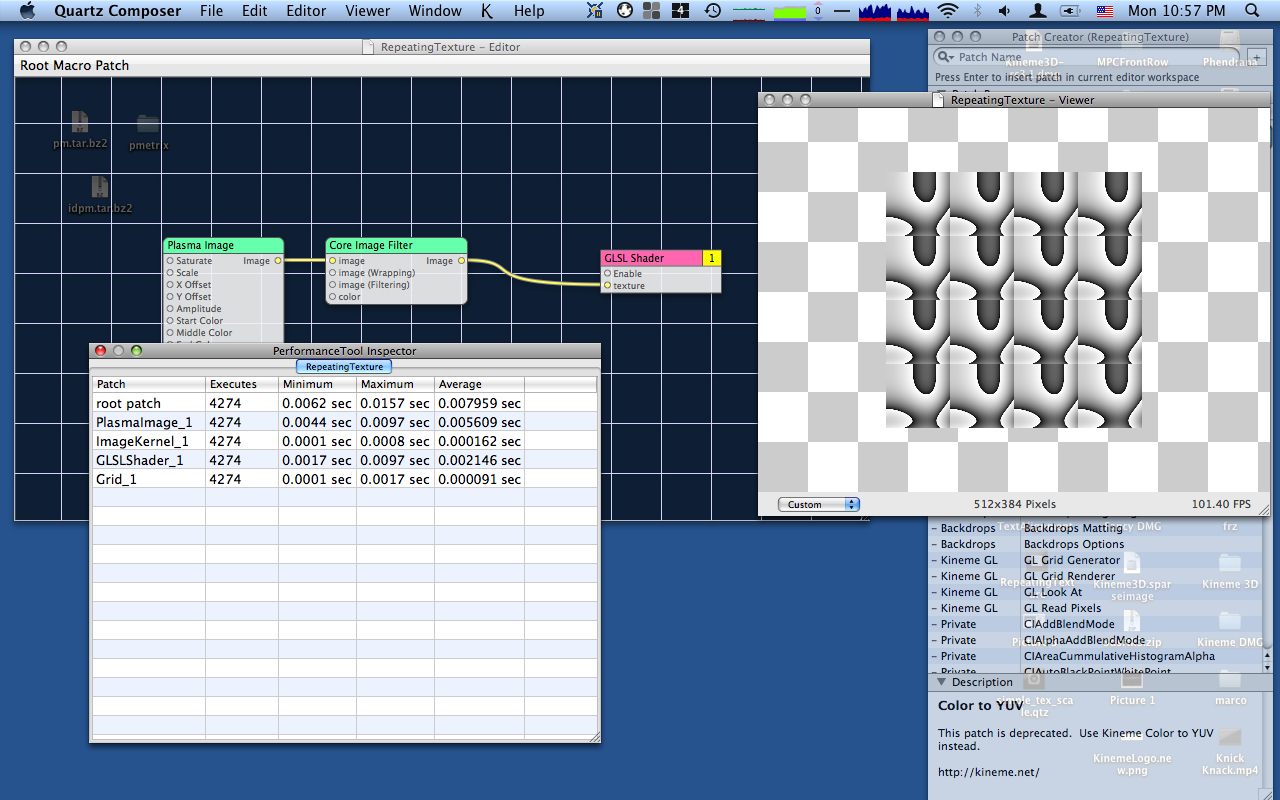
What exactly does the "excutes" parameter number value relate to?
And amazing that the Grid actually pops up on the tool!
Do you only see the macro level that you are currently on?
That's really a great tools for optimizing compositions !
Is there a way to isolate and compute separately GPU and CPU rendering load ?
It could be very helpful too !
As for suggestions: From looking at the screenshots, it looks great for simple compositions but I can see it getting a bit... long? for those thousand patch monsters.
Stuff I'd really like to see in it (in order of importance):
some kind of hierarchy, showing the structure of the compositions (i.e. something like finder's list view, with disclosure triangles). That would sort 2 problems out: it'd be much easier to find the figures for a particular patch, and it'd be much easier to figure out which patch the performance figures refer to (I can see some of mine just having a long list of "Core image filter" ortherwise :)
execution time for macros
more info, of course. Just as it is it would be very helpful, but if it also showed things like whether a patch is running in software or hardware would be good.
Good work on this, it's something I've been wanting for ages :)
I don't think so -- GL/GPU stuff is usually a bit asynchronous, so it's hard to find the load its placing on things.
I don't even know how to really calculate GPU load, to be honest... there aren't any gl calls to do that. I think there are some secrets in GL Driver Monitor, but those are all driver-specific, so it might take a long time (Plus a kindly donated ATI-driven macbook pro!) to get it working for all video cards :/
One thing I have loved is the "flatten"... but I wish it wouldn't get rid of what I have "written" in on the patches, or that I had the choice whether or not it does; every patch gets changed back to its generic "Apple" name.
I've toyed with the idea of a hierarchy, with disclosure triangles (this also would provide "self" time and "subpatch" time, which is currently just globbed together (a macro's average it its own working time, plus all its subpatches working times).
It only shows stats for patches that have run since the window is opened (the stats window) -- so you can just have one portion enabled, and it'll only show info for that. kinda tricky, but it's a start.
Macros are included (with the self/subpatch combination mistake noted above).
All patches run at least a little in "software" mode (QC calls the patches via software, even if what they do is hardware-based). There isn't a good way to find if a filter/shader/whatever runs in hardware or software, because they're supposed to "Just Work" (which they usually do)... I'll try and see if there's a way to figure that out... quickly poking through CoreImage doesn't turn up anything convincing...
wow chris....what a great tool...
What about the possibility to disable some processes (patches,macros...) on the fly from your performance tool inspector ?
Text or PDF export ?
Differents colors to identify patches, macros, externals...etc ?
Columbs with custom users color to locate some infos ?
Charts ?
Disabling could be handy -- not sure if it's possible or not (couldn't hurt, but might not take effect if something's plugged into the enable input, for example).
Text output wouldn't be hard (and would make profiling on different machines easy). I'll check that out.
colors would be immensely helpful too. I'm not entirely sure how to use them yet (I guess it could take the patch color, just like it takes the name, when available). custom columns would also be cool... not sure how to structure that yet though.
Charts, I'm not sure -- there's already the QC profiling charts, which show stuff composition-wide. There isn't much chart-worthy for individual patches that we can collect (we can't really tell what the patches do, only how long they take -- this is all done on the fly, so it has to be fast and simple analysis, otherwise your composition stalls, and the stats get all wrong). If you have some chart ideas though, maybe there's still a reason for it. (I also want to avoid charts so that I don't have to learn Cocoa drawing ;)
On the "tip" of not really knowing what can and cannot be done with this idea...
It would be AMAZING if something like this could give list input values of things like interpolation, x/y/z positions and rotations on render patches... and could actually be edited in this kind of graph format.
In trying to trigger macros to turn on and off at various points in the timeline... I might have one thing really deep into the qtz layer wise. So I want to tweak the period from 20 seconds to 21 seconds, and I end up having to back out of all of those layers, and then go deep into another set of layers in a different macro just to change that to 21 seconds as well. I know you can do things like publish the inputs through all of the layers so that this kind of stuff synchs up, but it's not an "organic way" of composing.
However, editing things like that on a grid like this would be really obvious and organic. I would look down the row and see every lfo or interpolate or math with a given value, and tweak them all accordingly. I imagine that could actually shave hours off of doing some of the more complex "music video" ideas I am trying to pull off, and would probably be a really awesome tool for all kinds of other reasons as well.
not really sure how a graph would improve the work flow of quartz, you got to remember the beauty of quartz is getting away from that kind of timeline. but i do agree if your are just able to view a hierarchal structure of your parameters in a list that is editable is defiantly a must for complex patches. being able to see all the parameters input values would be just insane think how long that list would be if you had a interpolate connected to a what ever input. im not really sure what this whole discussion is about i really haven't read it but i think a graph or list like this would be awesome for saving preset states, or initialization parameters. maybe you can do that all ready haven figured it out yet, but you know be able to save your whole patch at time a, b, c and then be able to call those states back would be cool
I agree with what you are saying about the beauty of the interface Dust, but if you saw that qtz for "storybook ending" (which I'm not really sure if I want to actually upload at any point)... I have these macros that are exactly the same in some places, but with different logic ops, and they layered over one another. At some places they trigger on and off at different times, have slightly different offsets (on purpose). A big mess when you have to go in a comp 10 layers down to tweak one lfo, and then back out, go down into another, 10 layers down, and then also tweak all of other parameters to interplay with the new programming.
From what I gather though, this is only reading what is running... so maybe it probably would get a reading off of a macro that I have tied to a trigger/conditional that isn't running yet. I think I am getting into something that isn't really appropriate for THIS tool...
Yes, what you've described is not really suitable for this tool (this is designed to be fast, and tell you what's taking time rendering, so you can restructure your compositions for a better framerate), but it's actually a really good idea, now that I think about it.
Stew over that idea some more, think through how it would work/how it would be used. If you're graphically inclined, whip up some mock ups that we can scrutinize/design towards, and file a feature request.
This could quite possibly be the one of the best ideas I never knew I needed, until you mentioned it...
It seems that the "Performance tools inspector" and all those numbers aligned in a spreadsheet are giving some news ideas...
But as the name says : it's an inspector, so the basic idea is to visualize some datas and not to edit them.
However the concept to be able to edit patches properties in a sort of tab UI is now evident....In my mind it could be a new feature for "kineme core", a sort of spotlight to find particular patches inside a QC composition ...
Interesting... and I saw your other post/mock-up on the kinemecore thread...
What I was thinking was more of something that looked like the patch creator, but that would ONLY list the patches used. THEN, you would select "lfo" (or whatever type of patch you want to observe globally, click on it, and it would open up something that would look like if all of the controls were published. You would also see some kind of nomenclature to designate inputs that are "hooked up" to something vs. those that are not. An input connected to something else might have it's number value with a "grey" cell behind it as. If you type in that cell, it would "break" the connection. And you would have a list of the values/settings.
I like your spotlight concept though, no doubt.
I could also see having an interface that looked something like a flow chart at the top, with arrows or noodles going to each box.... but that would actually "show" the structure of all of the levels/macros. Then on the bottom half of the editor you would see something that looks a lot like the interface we are already seeing here, except that it would list input/output values. Upon opening a comp in this, you would see every patch parameter... but if you clicked on the appropriate part of the flowchart above, it would narrow it down to just that level/macro.
I've thought of other twists as well, just don't want to jump the gun. I like your searchable idea though. That way you could also set up things like input splitters with special terms as you are making the comp even, taking into account that those would all pull up in the "spotlight" later. Or you could rename an LFO to Larry or whatever, and search out all of those.
I like the idea of something with a spotlight up in the top corner, then a scrollable panel with an exploded chart of the whole comp, that could be mouse clickable as a top window.. and then at the bottom, a chart structure like what we are seeing here. Using either the spotlight, or clicking on a level, or macro on the "exploded" view would narrow down what is listed in the graph. Something sort of like the iTunes view were you see genre/artist/album listed (that's were the master flow chart/ view of the whole comp would be)... then the editable patch list would look a lot like the name/time/artist fields. Over where "library" is, is where you the "patch creator/inspector" would be that you could search through, hit lfo/interpolation/sprite... and all of those would come up. Or you could go to the right corner and use the Spotlight feature.
I view it as looking very much like as a panel that looked like that kind of iTunes setup. I've thought of few other really valid setups/working techniques... probably shouldn't have written this post so soon actually!
(ps.... sorry if what I have written is convoluted and doesn't make sense to anyone besides me... I do plan on breaking out something to cobble together a picture sometime this weekend).
Yeah those friggin' iterators "suck" literally....cpu.
(BTW, here's a feature request that comes from looking at the pic of the gradient on the background of the QCrystal... a high quality gradient patch. I hate how you can "see" the lines from the gradient, and it bites me in the butt on my own compositions sometimes.)
The thumbnail image (the small one you see in the post) is intentionally "posterized" to 32 levels -- I sometimes do that for thumbnails because it makes them smaller (the thumb was originally ~300k, after posterization it's ~172k -- orig is 588k, you see that when you click the thumbnail). It normally isn't too noticeable, except for smooth gradients (where it makes them look Really bad, like this :)
To fix that, there's not really anything magical you can do -- perhaps passing it through a Bayer ditherer or something would convolute/scatter pixels to make the lines less apparent. (see smokris' example composition on this in CoreImage)
[such sharp eyes, and yet you missed the modernized K icon for KinemeCore -- I'm torn ;) ]
No, I just haven't mentioned it!!! When I first saw it pop up, I was too busy looking at weird 3DS files, blowing up my computer with particles in replication patches w/vertex shading, and screaming at obj. load times :o)
I like it and the font change-up though... very much :o) I noticed it in the alpha/beta/whatever of this past Quartz Crystal but forgot to mention it. It kind of spooked me to see the K on the last Structure Tools update as well... I thought it was some kind of special thing for the 3D patch, but I like how you are doing that on all of them now.
The more I think about it, I like the idea of it being some kind of kinemcore add on where you could pull up a patch inspector type of thing that only shows all of the types of patches used in your comp. Once you select a patch type from that window, you could flip to something akin to "settings" but that would show the settings for every instance of it within the composition... it could look GUI-wise if you were looking at patch parameters... pretty much exactly like the standard GUI, just that you see "all" of the, say "lfo", settings for example in one master setting inspector. The spotlight could also be up top so that you could just type in whatever, and pull them up... (gotta love my using unspecific pronouns, huh?).
An outline hierarchy is just as valid as the standard QC gui, and perhaps preferable though!
I haven't mocked anything up because I keep thinking of different twists... and holiday antics, etc....
ok so i have looked more closely at this thread. i see what you have going on, and like the the new hierarchal performance additions. so what i was thinking of is basically what you are seeing in these pics.
so i have noticed if you change a parameter type in a patch the connection gets cut. well this can pose a problem to the above mentioned idea. if the type of parameter change is an accepted type like lets say changing float to string than the patch should not be cut. so this is just one thing to think about.
so my idea is to have this list, both in hierarchal list view but also some sort of levels view. take interface builder as a example of how connections from controllers to views can be made.
so the graph is like this. you have an inspector for each level of the composition. k.
the new inspector has a list. so what you see when you open root level kineme inspector is just a list of patches that reside on that level. if you click on the inputs icon to the left of the patch name a hud pops up listing all the input parameters and settings for selected macro patch. you can type in a new value for any of the given parameters. there is a circle filled representing that that parameters are connected to something. click on it and the corresponding patches output hud pops up make more changes if needed. if you want to change connections click hold on circle and drag line to an existing macro patch name in the list then its input hud pops up letting you connect the wire to the parameter you want. at any given time there are only the IO hud windows for the connections and the patch names list open so you can not be confused. the little circle that indicates connections is color coded to let you know what is connected to what. if a patch is connect to lets say [n] connections just a list of those patch names pops up and not their hud windows because you could have a mess of window so you want to keep it manageable but still be able to connect anything to anything from the root list. if that makes any since.
now lets say you want to connect a output to a macro patch that is not in the document. you drag the wire on top of the + icon and a new kind of patch creator pops up. you find the patch you want to add hold hover over the input icon next to the add patch name and hud of inputs for that patch pops up and you finally let go once you are on the circle of the parameter you want and that patch is added to the list.
lets say you want to put a patch inside a replicate in space you click the names holding down the modifier shift key and then drag them on top of the replicate in spaces name. now you have another level inspector. you want to connect something from level one to level two you drag the wire to the a given icon representing level two and its patch list pops up and works like above mentioned.
i know thats sounds a bit more complicated than a row/col chart but these are only ideas. maybe i completely lost you. i actually went from table to a whole new interface but if you are able to edit the IO in the list as well as view the list parameter it would be much better, plus the ability to dynamically add patches to that list is even more better.
who knows if we request features maybe os x 10.8 or Lynx im calling it will have more advanced features. i will make a kineme request for composition save state plugin in the meantime and maybe make a mock up of how this whole list thing looks.
i know it sounded complicated but i guess in my mind it would improve work flow eliminate the need for all the noodles or wires and let you edit connect in the same sort of icon o' graphic or visual programing style that we like. you could even incorporate a thumb nail or preview viewer window in the root list so you can see the changes you are making.
blah blah blah quartz is cool. got to get back to iPhone my head hurts wish i could build things for iPhone icon o' graphically like quartz composer.
I've been thinking about this, and what you have is really an ideal interface. It is nice that it is similar to when you look at the breakdown of a qtz when in xCode, but contoured to fit this scenario.
Yeah, smokris played with it for a large portion of traveling home today (4-hour car ride, I was driving), and he found it overall quite useful as well (a few minor corrections, and some menu interface tweaks, but that's about it). Testing is largely complete, so it should be available early next week if all goes well.
Reversing my stance on GL Profiling in Performance Inspector, I've figured out a limited way to trap gl calls, do some profiling, and collect stats on them as well -- it's potentially incomplete. It relies on manually overriding CGL's GL dispatch, so patches that actually switch contexts (lousily written ones, or Render In Image, for example) won't necessarily get profiled, but it's better than nothing I suppose.
With some work, it would be possible to track how many textures/vbos a patch generates/uses, how large said buffers are (texture, fbo, vbo, etc), and how long each gl function takes (similar to OpenGL Profiler, though more limited). This gets tricky because a single patch (and thus a single line in PI) will generally make several gl calls per execute, so we either need to break down the patches more (more complex UI, much more complex code), or we can just accumulate all the gl overhead, and show a single aggregate GL cost of each patch).
Thoughts?
[note that the amount of work to pull this off is ridiculous -- it requires writing an instrumented version of every GL call, and a ton of bookkeeping, among other things.]


I'm still taking it all in... even as just a breakdown it is useful as heck. Oh man, it would have been a dream for sorting through all those macros for that Storybook Ending "video/qtz". I would get lost sometimes!
What exactly does the "excutes" parameter number value relate to?
And amazing that the Grid actually pops up on the tool!
Do you only see the macro level that you are currently on?
This is going to be tremendously useful. Awesome job.
That's really a great tools for optimizing compositions ! Is there a way to isolate and compute separately GPU and CPU rendering load ? It could be very helpful too !
This looks invaluable!
As for suggestions: From looking at the screenshots, it looks great for simple compositions but I can see it getting a bit... long? for those thousand patch monsters.
Stuff I'd really like to see in it (in order of importance):
Good work on this, it's something I've been wanting for ages :)
I don't think so -- GL/GPU stuff is usually a bit asynchronous, so it's hard to find the load its placing on things.
I don't even know how to really calculate GPU load, to be honest... there aren't any gl calls to do that. I think there are some secrets in GL Driver Monitor, but those are all driver-specific, so it might take a long time (Plus a kindly donated ATI-driven macbook pro!) to get it working for all video cards :/
One thing I have loved is the "flatten"... but I wish it wouldn't get rid of what I have "written" in on the patches, or that I had the choice whether or not it does; every patch gets changed back to its generic "Apple" name.
I've toyed with the idea of a hierarchy, with disclosure triangles (this also would provide "self" time and "subpatch" time, which is currently just globbed together (a macro's average it its own working time, plus all its subpatches working times).
It only shows stats for patches that have run since the window is opened (the stats window) -- so you can just have one portion enabled, and it'll only show info for that. kinda tricky, but it's a start.
Macros are included (with the self/subpatch combination mistake noted above).
All patches run at least a little in "software" mode (QC calls the patches via software, even if what they do is hardware-based). There isn't a good way to find if a filter/shader/whatever runs in hardware or software, because they're supposed to "Just Work" (which they usually do)... I'll try and see if there's a way to figure that out... quickly poking through CoreImage doesn't turn up anything convincing...
wow chris....what a great tool... What about the possibility to disable some processes (patches,macros...) on the fly from your performance tool inspector ? Text or PDF export ? Differents colors to identify patches, macros, externals...etc ? Columbs with custom users color to locate some infos ? Charts ?
Disabling could be handy -- not sure if it's possible or not (couldn't hurt, but might not take effect if something's plugged into the enable input, for example).
Text output wouldn't be hard (and would make profiling on different machines easy). I'll check that out.
colors would be immensely helpful too. I'm not entirely sure how to use them yet (I guess it could take the patch color, just like it takes the name, when available). custom columns would also be cool... not sure how to structure that yet though.
Charts, I'm not sure -- there's already the QC profiling charts, which show stuff composition-wide. There isn't much chart-worthy for individual patches that we can collect (we can't really tell what the patches do, only how long they take -- this is all done on the fly, so it has to be fast and simple analysis, otherwise your composition stalls, and the stats get all wrong). If you have some chart ideas though, maybe there's still a reason for it. (I also want to avoid charts so that I don't have to learn Cocoa drawing ;)
On the "tip" of not really knowing what can and cannot be done with this idea...
It would be AMAZING if something like this could give list input values of things like interpolation, x/y/z positions and rotations on render patches... and could actually be edited in this kind of graph format.
In trying to trigger macros to turn on and off at various points in the timeline... I might have one thing really deep into the qtz layer wise. So I want to tweak the period from 20 seconds to 21 seconds, and I end up having to back out of all of those layers, and then go deep into another set of layers in a different macro just to change that to 21 seconds as well. I know you can do things like publish the inputs through all of the layers so that this kind of stuff synchs up, but it's not an "organic way" of composing.
However, editing things like that on a grid like this would be really obvious and organic. I would look down the row and see every lfo or interpolate or math with a given value, and tweak them all accordingly. I imagine that could actually shave hours off of doing some of the more complex "music video" ideas I am trying to pull off, and would probably be a really awesome tool for all kinds of other reasons as well.
not really sure how a graph would improve the work flow of quartz, you got to remember the beauty of quartz is getting away from that kind of timeline. but i do agree if your are just able to view a hierarchal structure of your parameters in a list that is editable is defiantly a must for complex patches. being able to see all the parameters input values would be just insane think how long that list would be if you had a interpolate connected to a what ever input. im not really sure what this whole discussion is about i really haven't read it but i think a graph or list like this would be awesome for saving preset states, or initialization parameters. maybe you can do that all ready haven figured it out yet, but you know be able to save your whole patch at time a, b, c and then be able to call those states back would be cool
I agree with what you are saying about the beauty of the interface Dust, but if you saw that qtz for "storybook ending" (which I'm not really sure if I want to actually upload at any point)... I have these macros that are exactly the same in some places, but with different logic ops, and they layered over one another. At some places they trigger on and off at different times, have slightly different offsets (on purpose). A big mess when you have to go in a comp 10 layers down to tweak one lfo, and then back out, go down into another, 10 layers down, and then also tweak all of other parameters to interplay with the new programming.
From what I gather though, this is only reading what is running... so maybe it probably would get a reading off of a macro that I have tied to a trigger/conditional that isn't running yet. I think I am getting into something that isn't really appropriate for THIS tool...
Yes, what you've described is not really suitable for this tool (this is designed to be fast, and tell you what's taking time rendering, so you can restructure your compositions for a better framerate), but it's actually a really good idea, now that I think about it.
Stew over that idea some more, think through how it would work/how it would be used. If you're graphically inclined, whip up some mock ups that we can scrutinize/design towards, and file a feature request.
This could quite possibly be the one of the best ideas I never knew I needed, until you mentioned it...
Ok, I'll try to take you up on that one.
this is some amazing stuff going on here. very useful, and the idea to be able to edit in a graph mode has tremendous potential!
It seems that the "Performance tools inspector" and all those numbers aligned in a spreadsheet are giving some news ideas... But as the name says : it's an inspector, so the basic idea is to visualize some datas and not to edit them. However the concept to be able to edit patches properties in a sort of tab UI is now evident....In my mind it could be a new feature for "kineme core", a sort of spotlight to find particular patches inside a QC composition ...
Interesting... and I saw your other post/mock-up on the kinemecore thread...
What I was thinking was more of something that looked like the patch creator, but that would ONLY list the patches used. THEN, you would select "lfo" (or whatever type of patch you want to observe globally, click on it, and it would open up something that would look like if all of the controls were published. You would also see some kind of nomenclature to designate inputs that are "hooked up" to something vs. those that are not. An input connected to something else might have it's number value with a "grey" cell behind it as. If you type in that cell, it would "break" the connection. And you would have a list of the values/settings.
I like your spotlight concept though, no doubt.
I could also see having an interface that looked something like a flow chart at the top, with arrows or noodles going to each box.... but that would actually "show" the structure of all of the levels/macros. Then on the bottom half of the editor you would see something that looks a lot like the interface we are already seeing here, except that it would list input/output values. Upon opening a comp in this, you would see every patch parameter... but if you clicked on the appropriate part of the flowchart above, it would narrow it down to just that level/macro.
I've thought of other twists as well, just don't want to jump the gun. I like your searchable idea though. That way you could also set up things like input splitters with special terms as you are making the comp even, taking into account that those would all pull up in the "spotlight" later. Or you could rename an LFO to Larry or whatever, and search out all of those.
I like the idea of something with a spotlight up in the top corner, then a scrollable panel with an exploded chart of the whole comp, that could be mouse clickable as a top window.. and then at the bottom, a chart structure like what we are seeing here. Using either the spotlight, or clicking on a level, or macro on the "exploded" view would narrow down what is listed in the graph. Something sort of like the iTunes view were you see genre/artist/album listed (that's were the master flow chart/ view of the whole comp would be)... then the editable patch list would look a lot like the name/time/artist fields. Over where "library" is, is where you the "patch creator/inspector" would be that you could search through, hit lfo/interpolation/sprite... and all of those would come up. Or you could go to the right corner and use the Spotlight feature.
I view it as looking very much like as a panel that looked like that kind of iTunes setup. I've thought of few other really valid setups/working techniques... probably shouldn't have written this post so soon actually! (ps.... sorry if what I have written is convoluted and doesn't make sense to anyone besides me... I do plan on breaking out something to cobble together a picture sometime this weekend).
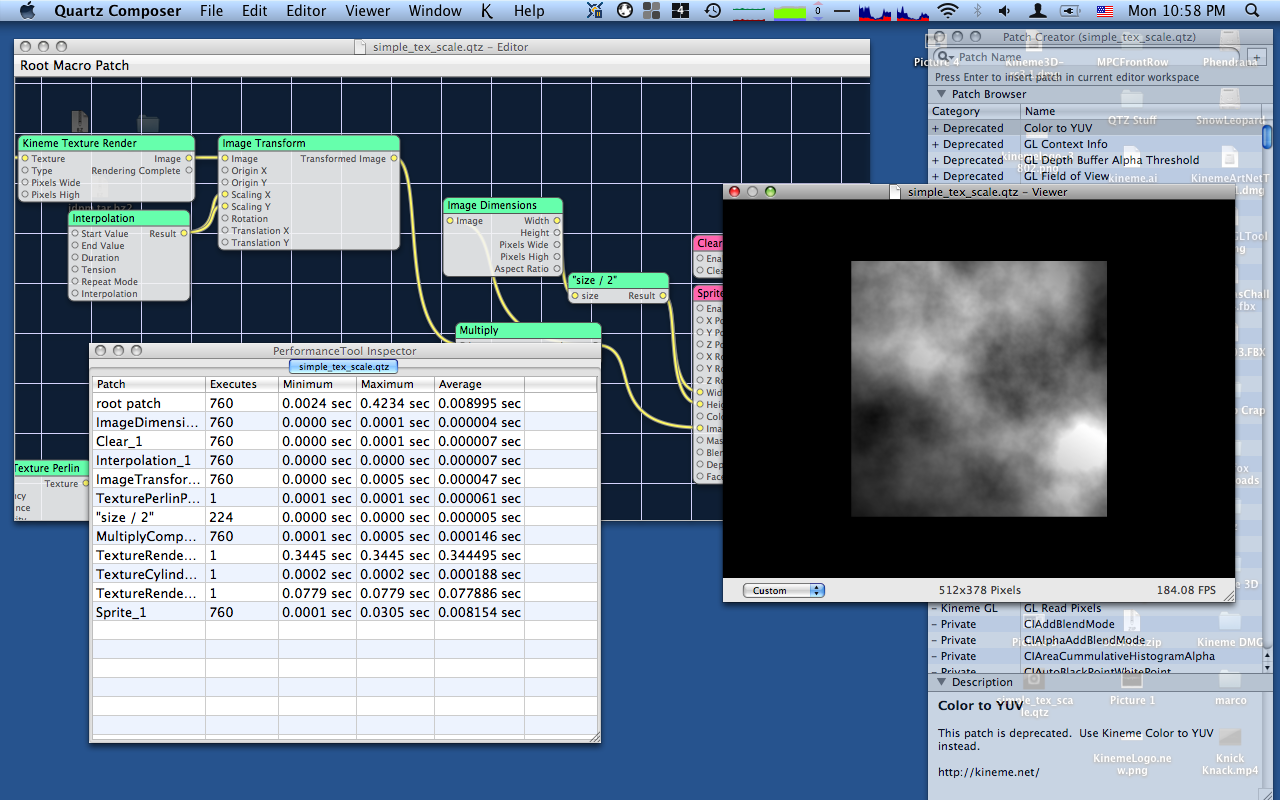
Here's an updated shot.
New stuff includes: A hierarchy, more stats info (self time, % time), sortable columns, and togglable columns (like iTunes).
(Also, note how "Scroller" is taking up 26% of the cpu... that's an iterator (not counting its subpatch cost) -- sucks!)
Very cool!
Yeah those friggin' iterators "suck" literally....cpu.
(BTW, here's a feature request that comes from looking at the pic of the gradient on the background of the QCrystal... a high quality gradient patch. I hate how you can "see" the lines from the gradient, and it bites me in the butt on my own compositions sometimes.)
The thumbnail image (the small one you see in the post) is intentionally "posterized" to 32 levels -- I sometimes do that for thumbnails because it makes them smaller (the thumb was originally ~300k, after posterization it's ~172k -- orig is 588k, you see that when you click the thumbnail). It normally isn't too noticeable, except for smooth gradients (where it makes them look Really bad, like this :)
To fix that, there's not really anything magical you can do -- perhaps passing it through a Bayer ditherer or something would convolute/scatter pixels to make the lines less apparent. (see smokris' example composition on this in CoreImage)
[such sharp eyes, and yet you missed the modernized K icon for KinemeCore -- I'm torn ;) ]
I like this (along with some discussion elsewhere on this thread that mentions similar ideas)
Spotlighting for patches, and editing patch properties via an outline hierarchy could be very cool :)
No, I just haven't mentioned it!!! When I first saw it pop up, I was too busy looking at weird 3DS files, blowing up my computer with particles in replication patches w/vertex shading, and screaming at obj. load times :o)
I like it and the font change-up though... very much :o) I noticed it in the alpha/beta/whatever of this past Quartz Crystal but forgot to mention it. It kind of spooked me to see the K on the last Structure Tools update as well... I thought it was some kind of special thing for the 3D patch, but I like how you are doing that on all of them now.
Good idea on the gradient!
Yeah, the spotlight idea is truly cool.
The more I think about it, I like the idea of it being some kind of kinemcore add on where you could pull up a patch inspector type of thing that only shows all of the types of patches used in your comp. Once you select a patch type from that window, you could flip to something akin to "settings" but that would show the settings for every instance of it within the composition... it could look GUI-wise if you were looking at patch parameters... pretty much exactly like the standard GUI, just that you see "all" of the, say "lfo", settings for example in one master setting inspector. The spotlight could also be up top so that you could just type in whatever, and pull them up... (gotta love my using unspecific pronouns, huh?).
An outline hierarchy is just as valid as the standard QC gui, and perhaps preferable though!
I haven't mocked anything up because I keep thinking of different twists... and holiday antics, etc....
ok so i have looked more closely at this thread. i see what you have going on, and like the the new hierarchal performance additions. so what i was thinking of is basically what you are seeing in these pics.
so i have noticed if you change a parameter type in a patch the connection gets cut. well this can pose a problem to the above mentioned idea. if the type of parameter change is an accepted type like lets say changing float to string than the patch should not be cut. so this is just one thing to think about.
so my idea is to have this list, both in hierarchal list view but also some sort of levels view. take interface builder as a example of how connections from controllers to views can be made.
so the graph is like this. you have an inspector for each level of the composition. k.
the new inspector has a list. so what you see when you open root level kineme inspector is just a list of patches that reside on that level. if you click on the inputs icon to the left of the patch name a hud pops up listing all the input parameters and settings for selected macro patch. you can type in a new value for any of the given parameters. there is a circle filled representing that that parameters are connected to something. click on it and the corresponding patches output hud pops up make more changes if needed. if you want to change connections click hold on circle and drag line to an existing macro patch name in the list then its input hud pops up letting you connect the wire to the parameter you want. at any given time there are only the IO hud windows for the connections and the patch names list open so you can not be confused. the little circle that indicates connections is color coded to let you know what is connected to what. if a patch is connect to lets say [n] connections just a list of those patch names pops up and not their hud windows because you could have a mess of window so you want to keep it manageable but still be able to connect anything to anything from the root list. if that makes any since.
now lets say you want to connect a output to a macro patch that is not in the document. you drag the wire on top of the + icon and a new kind of patch creator pops up. you find the patch you want to add hold hover over the input icon next to the add patch name and hud of inputs for that patch pops up and you finally let go once you are on the circle of the parameter you want and that patch is added to the list.
lets say you want to put a patch inside a replicate in space you click the names holding down the modifier shift key and then drag them on top of the replicate in spaces name. now you have another level inspector. you want to connect something from level one to level two you drag the wire to the a given icon representing level two and its patch list pops up and works like above mentioned.
i know thats sounds a bit more complicated than a row/col chart but these are only ideas. maybe i completely lost you. i actually went from table to a whole new interface but if you are able to edit the IO in the list as well as view the list parameter it would be much better, plus the ability to dynamically add patches to that list is even more better.
who knows if we request features maybe os x 10.8 or Lynx im calling it will have more advanced features. i will make a kineme request for composition save state plugin in the meantime and maybe make a mock up of how this whole list thing looks.
i know it sounded complicated but i guess in my mind it would improve work flow eliminate the need for all the noodles or wires and let you edit connect in the same sort of icon o' graphic or visual programing style that we like. you could even incorporate a thumb nail or preview viewer window in the root list so you can see the changes you are making.
blah blah blah quartz is cool. got to get back to iPhone my head hurts wish i could build things for iPhone icon o' graphically like quartz composer.
I've been thinking about this, and what you have is really an ideal interface. It is nice that it is similar to when you look at the breakdown of a qtz when in xCode, but contoured to fit this scenario.
Yeah, smokris played with it for a large portion of traveling home today (4-hour car ride, I was driving), and he found it overall quite useful as well (a few minor corrections, and some menu interface tweaks, but that's about it). Testing is largely complete, so it should be available early next week if all goes well.
Reversing my stance on GL Profiling in Performance Inspector, I've figured out a limited way to trap gl calls, do some profiling, and collect stats on them as well -- it's potentially incomplete. It relies on manually overriding CGL's GL dispatch, so patches that actually switch contexts (lousily written ones, or Render In Image, for example) won't necessarily get profiled, but it's better than nothing I suppose.
With some work, it would be possible to track how many textures/vbos a patch generates/uses, how large said buffers are (texture, fbo, vbo, etc), and how long each gl function takes (similar to OpenGL Profiler, though more limited). This gets tricky because a single patch (and thus a single line in PI) will generally make several gl calls per execute, so we either need to break down the patches more (more complex UI, much more complex code), or we can just accumulate all the gl overhead, and show a single aggregate GL cost of each patch).
Thoughts?
[note that the amount of work to pull this off is ridiculous -- it requires writing an instrumented version of every GL call, and a ton of bookkeeping, among other things.]