|
|
PerformanceInspector(PerformanceInspector was designed for Mac OS 10.5, and doesn't work in Mac OS 10.6+.) PerformanceInspector is an advanced profiling tool for Quartz Composer. Unlike the built-in profiling tools, PerformanceInspector performs a patch-by-patch analysis of the performance of your compositions while they're running, providing you with detailed information on which patches, exactly, are slowing your composition down. PerformanceInspector is accessible through the Viewer menu of Quartz Composer. When installed, three additional items are added to the bottom of the list, shown in the following picture.
You can activate PerformanceInspector from the menu, or by simply pressing Ctrl-Command-P at any time. When activated, PerformanceInspector will open a new window. Closing the window will deactivate PerformanceInspector, and discard all measurements and statistics. The statistics window is empty by default -- it doesn't measure anything until the Viewer is open, and the composition is running. When PerformanceInspector has collected some data, it will begin to show it and update it as it collects more.
Each line represents a single patch in your composition. If you've entered a name on the patch's title, that will be displayed instead, making them easier to identify. Columns can be resized and rearranged, and you can add/remove columns that aren't useful to the analysis you're performing.
The Patch column shows each patch in your composition, starting at the Root Macro Patch. This column cannot be removed. The Executes column counts the number of times the patch has been executed. When a patch is disabled, or all its consumers are disabled, it will cease to execute. Iterators, Replicate in Time, and Replicate in Space can execute their subpatches multiple times. Multiplexers also execute only the patches that are necessary to generate output. The % Time column is perhaps the most useful; It shows the amount of time spent per-frame in each patch. In the above example, 96.20% of each frame is spent in the KinemeGLTorusPatch -- this is expected, since it's the only patch actually rendering anything. When a patch containing subpatches is collapsed in the Patch column, the % Time column will show the sum of all its subpatches, allowing you to quickly identify macros that are taking the the most time to execute. The Minimum column shows the smallest amount of time the patch has ever taken to execute. This represents a "best-case" run. Similarly, the Maximum column shows the largest amount of time the patch has taken to execute. This represents a "worst-case" run. And finally, the Average Time column shows the average run time of the patch. This represents the typical run, and is calculated by dividing the patch's total time by the number of executions. Minimum, Maximum, and Average Time columns include subpatches in their calculations -- that's why the Camera patch has a slightly longer Average time than the KinemeGLTorusPatch inside it, and why the Root Macro Patch has the largest average time of all; It's including all its subpatches, plus its own run time. Self Time reflects the patch's Average Time Excluding subpatches. This shows how much time the individual patch takes per-execute, on average, all by itself. The Safe? and 64 Bit columns are informational columns to help you quickly identify patches that will work in safe-mode environments, and patches that will work in 64 Bit environments. They don't change as the composition is running, and are simply there for convenience. (Note that if you have a Safe-Mode enabling plugin installed, such as Safe Audio, this column will incorrectly identify the patch as Safe!) Caveats with PerformanceInspectorAs with all profiling utilities, it is essential that you properly analyze the results and perform tests to get a clear understanding of what's actually taking time. Let's walk through a quick example of a common not-so-clear case. Here's our composition:
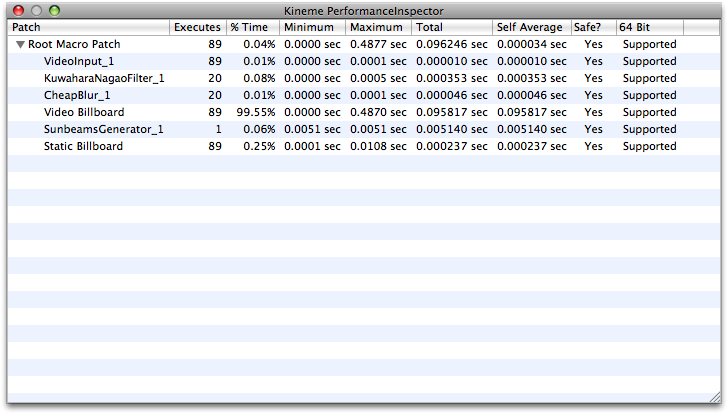
And here's our corresponding PerformanceInspector output:
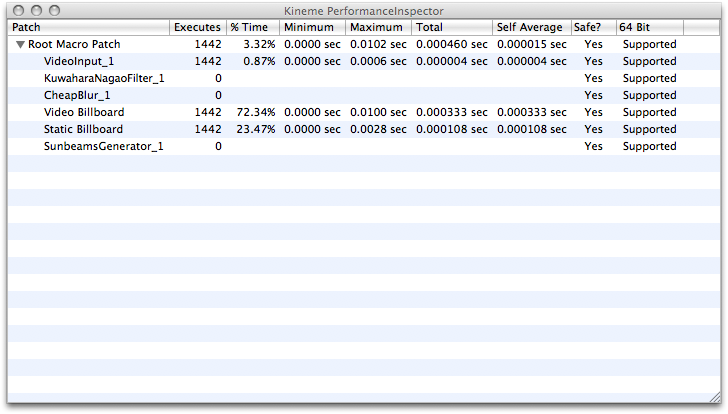
If you look carefully, you'll notice that the Video Billboard is taking significantly more time than the Static Billboard. Yet they're both doing essentially the same thing: Taking an image, and rendering it on screen. So why are they taking such noticeably different times? The answer lies in the way CoreImage works. The Video Billboard has a very expensive CoreImage filter chain feeding its Image Input. The Static Billboard, in contrast, does not. CoreImage evaluates images lazily -- that is, it doesn't actually perform any filtering until the output is actually needed. No patch needs those images except for the Billboard, which then has to have CoreImage render the image, which takes a lot of time. The actual filter patches (KuwaharaNagaoFilter and CheapBlur) don't take much time themselves; They simply tell CoreImage which filter to apply next, and what settings, should the need arise. Skipping the two filters leads to a very different profile:
There's still some overhead associated with QuickTime decoding the Video Input patch's data, but overall the times are much closer. Another limitation of PerformanceInspector is due to the way it collects information. This data collection has been written to be extremely fast, but it's not free. For most compositions, it's fast enough that it takes place when the CPU would otherwise be waiting for the GPU anyway, so there's no performance impact, but for some compositions there is a noticeable drop in performance while profiling. The reflected data are still generally accurate, but they start to get skewed a bit (higher-level patches will appear slightly more time-consuming than they really are). The skewing should be less than a few percent under normal circumstances, but extremely heavy iteration/replication can cause it to become much more significant. |
Documentation |